Building a Three-Node HA K3s Homelab
A practical RHEL 10.2 and VirtualBox homelab build with three K3s server nodes, embedded etcd, Prometheus, Grafana, and secure Cloudflare Tunnel access.
I built this Kubernetes homelab to gain practical experience with highly available control planes, embedded etcd, Kubernetes monitoring, Helm deployments, private networking, bastion-based administration, and secure public access through Cloudflare Tunnel.
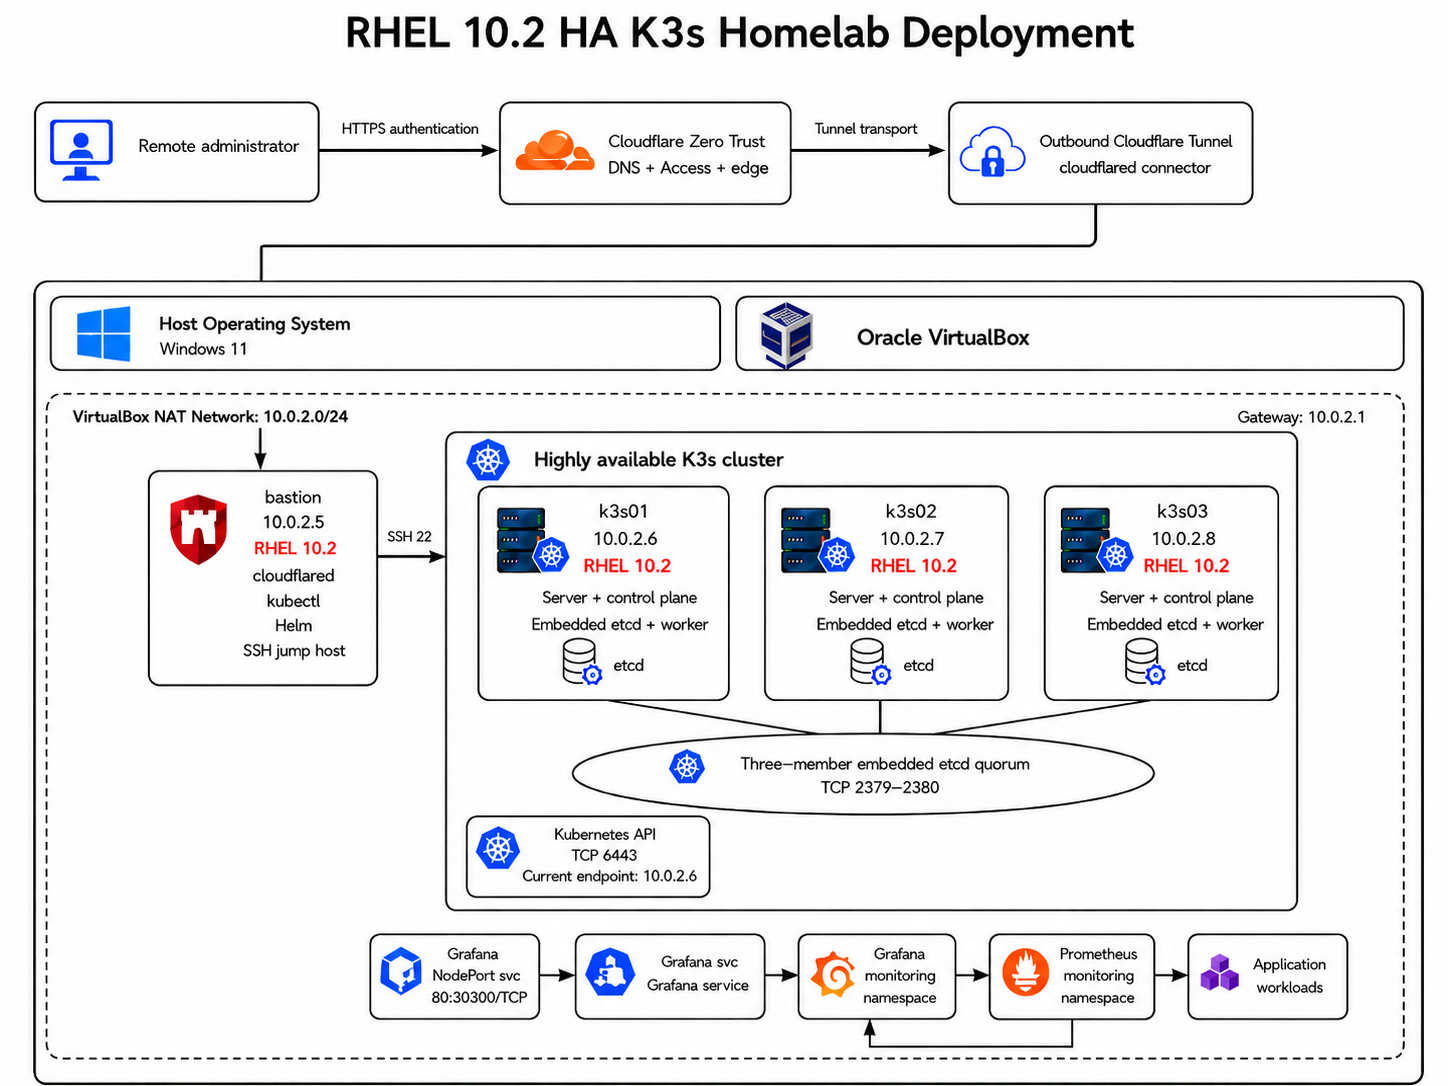
The environment runs entirely on a Windows 11 computer using Oracle VirtualBox. The final design consists of one bastion server and three RHEL 10.2 nodes forming a highly available K3s cluster.
This article documents the architecture, deployment process, monitoring setup, remote-access design, problems encountered, and current limitations of the environment.
Architecture overview
The homelab contains four virtual machines connected to a VirtualBox NAT Network.
| Host | IP address | Role |
|---|---|---|
bastion | 10.0.2.5 | Administrative jump host, Cloudflare connector, Helm and kubectl client |
k3s01 | 10.0.2.6 | K3s server, control plane, embedded etcd member, and worker |
k3s02 | 10.0.2.7 | K3s server, control plane, embedded etcd member, and worker |
k3s03 | 10.0.2.8 | K3s server, control plane, embedded etcd member, and worker |
| VirtualBox gateway | 10.0.2.1 | Default gateway for the virtual network |
All guest systems run RHEL 10.2. The Windows 11 host runs Oracle VirtualBox, which provides the isolated 10.0.2.0/24 virtual network used by the servers.
The complete architecture includes:
- A dedicated bastion server
- Three K3s server nodes
- A three-member embedded etcd quorum
- Kubernetes workloads distributed across all three nodes
- Prometheus for metrics collection
- Grafana for dashboards and visualization
- Helm for application lifecycle management
- Cloudflare Zero Trust for remote access
- Cloudflare Tunnel for outbound-only public connectivity
- Grafana exposure through a Kubernetes NodePort service
Why I selected a three-server K3s cluster
The initial design considered one K3s server and two worker nodes. I later changed this to three K3s server nodes using embedded etcd.
Each K3s node now performs four roles:
- Kubernetes control-plane node
- Embedded etcd member
- K3s server
- Kubernetes worker
This design provides an odd number of etcd members, which is required for reliable quorum decisions. With three members, the cluster can tolerate one member failure and still maintain quorum:
Required quorum = 2 of 3 members
All three nodes are also schedulable workers, allowing application workloads to use the resources across the complete cluster.
k3s01 --+
k3s02 --+-- Three-member embedded etcd quorum
k3s03 --+
The etcd members communicate over TCP ports 2379 and 2380.
VirtualBox network design
The four virtual machines use a VirtualBox NAT Network:
Network: 10.0.2.0/24
Gateway: 10.0.2.1
A NAT Network allows the virtual machines to communicate directly with one another while still providing outbound internet access.
This differs from standard VirtualBox NAT mode. Normal NAT commonly places each VM behind an isolated virtual NAT instance, which can prevent direct VM-to-VM communication.
The required routing table on each VM resembles:
default via 10.0.2.1
10.0.2.0/24 directly connected
I encountered an issue where the K3s nodes could not communicate because different VirtualBox network adapter modes were enabled simultaneously. One VM also temporarily had no default route.
The fix was to connect the required machines to the same VM-to-VM-capable NAT Network and remove the conflicting adapter configuration.
Static IP addressing and hostname resolution
Each virtual machine uses a stable IP address. Because the homelab does not currently contain an internal DNS server, I use /etc/hosts for hostname resolution.
The following entries are required on the bastion and every K3s node:
10.0.2.5 bastion
10.0.2.6 k3s01
10.0.2.7 k3s02
10.0.2.8 k3s03
This allows the following commands to work without external DNS:
ssh trikto@k3s01
ssh trikto@k3s02
ssh trikto@k3s03
The operating-system hostnames were also configured to match these names.
Bastion server
The bastion server is the primary administrative entry point for the environment. It runs:
cloudflaredkubectl- Helm
- OpenSSH
- The Kubernetes kubeconfig
- Administrative tooling
The bastion is not part of the K3s cluster. It does not run Kubernetes workloads and is not an etcd member. This separation provides a clean administrative boundary.
The normal management paths are:
Administrator -> Bastion -> K3s nodes
Bastion -> Kubernetes API
The bastion connects to K3s nodes over SSH port 22 and to the Kubernetes API over TCP port 6443.
Preparing the RHEL 10.2 nodes
Before installing K3s, I prepared the RHEL systems for Kubernetes operation. The main tasks included:
- Assigning static IP addresses
- Configuring hostnames
- Updating
/etc/hosts - Disabling swap
- Retaining
firewalld - Allowing required Kubernetes and K3s traffic
- Verifying node-to-node connectivity
- Confirming the default route
- Installing required operating-system packages
Swap was disabled immediately:
sudo swapoff -a
The relevant swap entry must also be removed or commented out in /etc/fstab so swap does not return after a reboot.
Important K3s ports include:
| Port | Protocol | Purpose |
|---|---|---|
6443 | TCP | Kubernetes API |
2379-2380 | TCP | Embedded etcd |
10250 | TCP | Kubelet |
8472 | UDP | Flannel VXLAN |
30000-32767 | TCP/UDP | Kubernetes NodePort range |
The final SELinux mode still needs to be verified and documented. It should not be assumed to be enforcing until confirmed with:
getenforce
Deploying the first K3s server
The first server, k3s01 at 10.0.2.6, initialized the embedded etcd cluster. Only this first server uses the K3s cluster initialization option:
--cluster-init
After installation, I verified the service, initial node, and system pods:
sudo systemctl status k3s
sudo k3s kubectl get nodes -o wide
sudo k3s kubectl get pods -A
The K3s node token was obtained from k3s01 and used to join the remaining servers.
Joining k3s02 and k3s03
The two additional servers joined the cluster through the Kubernetes API endpoint on k3s01:
https://10.0.2.6:6443
They joined as K3s servers, not agents. This distinction matters because all three machines participate in the control plane and embedded etcd quorum.
The expected cluster state was:
k3s01  Ready  control-plane,etcd,master
k3s02  Ready  control-plane,etcd,master
k3s03  Ready  control-plane,etcd,master
Check the nodes and system components with:
kubectl get nodes -o wide
kubectl get pods -A
Configuring kubectl on the bastion
K3s stores its administrative kubeconfig on the server node. I copied the kubeconfig from k3s01 to the bastion.
The default server address in a K3s kubeconfig normally points to:
https://127.0.0.1:6443
That address only works locally on the K3s server. On the bastion, I changed it to:
https://10.0.2.6:6443
The bastion could then manage the cluster directly:
kubectl get nodes
kubectl get pods -A
kubectl get svc -A
Helm uses the same kubeconfig when installing and upgrading applications.
Installing Helm
Helm was installed on the bastion to manage Kubernetes applications. I added the Prometheus Community repository and updated the local index:
helm repo add prometheus-community https://prometheus-community.github.io/helm-charts
helm repo update
Helm is used for installing Prometheus and Grafana, updating configuration, managing releases, rolling back failed deployments, and inspecting application status.
List releases across all namespaces with:
helm list -A
Deploying Prometheus
Prometheus was deployed in the monitoring namespace using the kube-prometheus-stack Helm chart. The release name is kps.
The deployment provides Kubernetes monitoring components that collect metrics from:
- Kubernetes nodes
- Kubelets
- Kubernetes API components
- Cluster workloads
- Control-plane components
- Node exporters
- Kubernetes service monitors
The installation followed this pattern:
helm upgrade --install kps prometheus-community/kube-prometheus-stack \
  --namespace monitoring \
  --create-namespace \
  --values prometheus-values.yaml \
  --wait \
  --timeout 15m
The selected Prometheus configuration included:
- Seven-day metric retention
- Persistent storage
- A 10 Gi Prometheus volume
- A 2 Gi Alertmanager volume
- The K3s
local-pathstorage class - Grafana disabled inside the Prometheus stack
Grafana was disabled in the stack because it was installed and managed separately.
Check the monitoring components with:
kubectl get pods -n monitoring
kubectl get svc -n monitoring
kubectl get pvc -n monitoring
Deploying Grafana separately
Grafana was installed as a separate Helm release named grafana in the monitoring namespace. This provides independent control over:
- Grafana upgrades
- Persistent storage
- Service exposure
- Authentication
- Dashboard provisioning
- Sidecar configuration
- Public access
- Grafana-specific Helm values
The Grafana deployment initially experienced a readiness-probe failure, but the pod later reached the running state.
Grafana obtains monitoring data from Prometheus through the internal Kubernetes service:
Grafana pod
    |
    v
Prometheus Kubernetes Service
    |
    v
Prometheus pod
Prometheus remains private inside the cluster. Only Grafana is exposed externally.
Grafana NodePort exposure
Grafana is exposed through a Kubernetes NodePort service:
Service port: 80
NodePort: 30300
Protocol: TCP
The effective endpoint is:
http://10.0.2.6:30300
The service routes the request to the selected Grafana workload:
10.0.2.6:30300
    |
    v
Grafana NodePort Service
    |
    v
Grafana pod
Inspect the service with:
kubectl get svc grafana -n monitoring -o wide
kubectl get svc grafana -n monitoring -o yaml
A result containing NodePort 80:30300/TCP confirms the mapping.
Traefik is not used for Grafana exposure
K3s includes Traefik as its default ingress controller, but Traefik is not part of the current Grafana public-access path.
The correct route is:
Cloudflare Tunnel
    |
    v
Bastion
    |
    v
K3s node IP:30300
    |
    v
Grafana NodePort Service
    |
    v
Grafana pod
The route Cloudflare Tunnel -> Traefik -> Grafana would apply only if a Kubernetes Ingress resource had been created for Grafana.
Confirm the current configuration with:
kubectl get ingress -n monitoring
If no Grafana ingress exists, Traefik is not handling Grafana traffic.
Cloudflare Tunnel
The cloudflared service runs on the bastion. Instead of opening inbound ports on the home router, it establishes an outbound encrypted connection to Cloudflare.
This provides:
- No public IP requirement
- No inbound router port forwarding
- No direct exposure of the home network
- Centralized authentication through Cloudflare Access
- Public hostnames managed through Cloudflare DNS
- TLS termination at the Cloudflare edge
Two hostnames are associated with the homelab:
bastion.gajan.dev
grafana.gajan.dev
The bastion hostname provides remote administrative access. The Grafana hostname provides browser-based HTTPS access.
Public Grafana traffic flow
Grafana is publicly available through https://grafana.gajan.dev.
Remote browser
    |
    v HTTPS
Cloudflare DNS and edge
    |
    v
Cloudflare Access authentication
    |
    v
Cloudflare Tunnel
    |
    v
cloudflared on bastion
    |
    v Private HTTP
10.0.2.6:30300
    |
    v
Grafana NodePort Service
    |
    v
Grafana pod
A conceptual Cloudflare ingress rule resembles:
ingress:
  - hostname: grafana.gajan.dev
    service: http://10.0.2.6:30300
  - service: http_status:404
The browser connects to Cloudflare using HTTPS, while cloudflared forwards the request privately to the NodePort endpoint inside the VirtualBox network. No public connection is made directly to 10.0.2.6.
Remote SSH access through Cloudflare
The bastion can also be accessed through bastion.gajan.dev. The tunnel forwards the SSH connection to the bastion's local SSH service:
bastion.gajan.dev
    |
    v
Cloudflare Tunnel
    |
    v
cloudflared on bastion
    |
    v
localhost:22
For an SSH client such as Xshell, a local cloudflared client can create a local TCP listener:
cloudflared access tcp \
  --hostname bastion.gajan.dev \
  --url localhost:2222
Xshell can then connect to:
Host: 127.0.0.1
Port: 2222
Opening the SSH hostname directly in a normal browser initially produced a black or unusable page. SSH is not an HTTP website and cannot be rendered as a standard web page.
Grafana and Prometheus integration
Grafana uses Prometheus as its monitoring data source. The data source should use the internal Kubernetes service name rather than a public hostname.
The exact service name depends on Helm-generated resources and can be identified with:
kubectl get svc -n monitoring
The connection stays entirely inside Kubernetes:
Grafana -> ClusterIP service -> Prometheus
This avoids exposing Prometheus to the public internet.
Grafana dashboards can visualize node CPU utilization, memory and disk usage, pod health, container restarts, Kubernetes API metrics, deployment replicas, network traffic, persistent-volume usage, and overall cluster resource consumption.
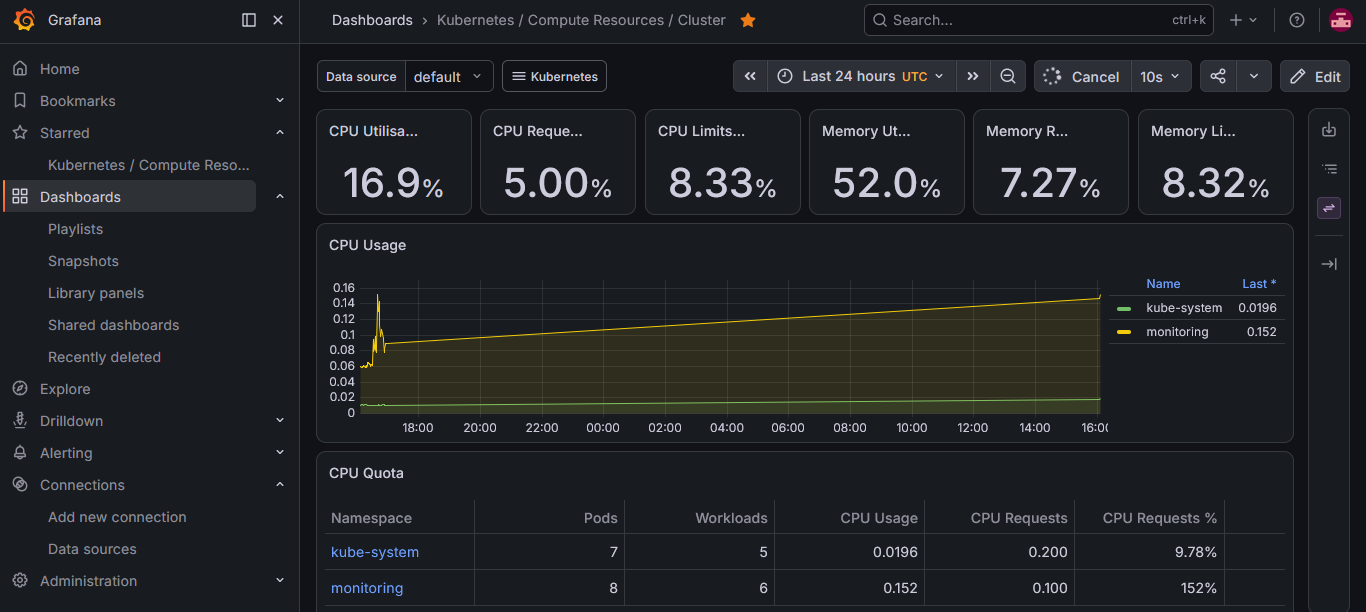
The cluster dashboard provides a quick view of CPU utilization, requests and limits, memory utilization, namespace workloads, and quota pressure.
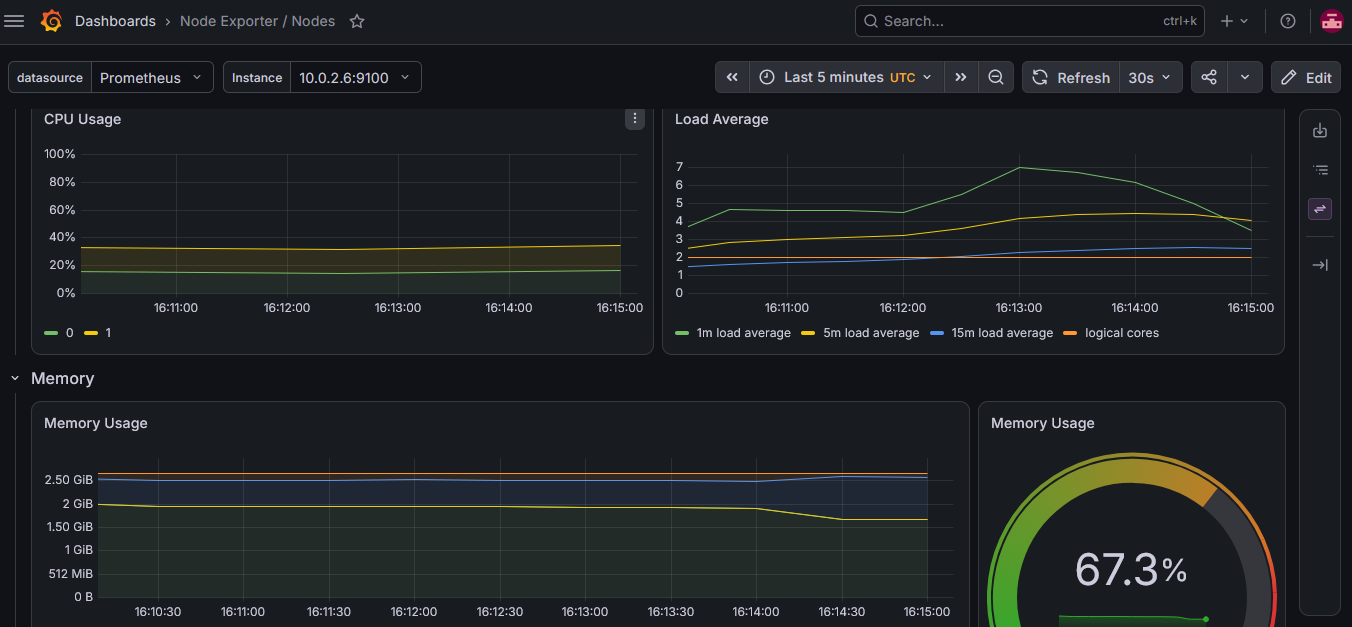
The Node Exporter dashboard provides node-level CPU, load-average, and memory visibility.
Grafana dashboard provisioning
The Grafana deployment includes dashboard provisioning support. A dashboard sidecar can watch Kubernetes ConfigMaps containing dashboard definitions and load them into Grafana automatically.
During configuration, a sidecar-related HTTP 401 response was observed. This issue was related to Grafana-side authentication or sidecar credentials. It was separate from the Cloudflare Tunnel and NodePort exposure path.
That distinction is important:
Public-access problem:
Cloudflare -> Bastion -> NodePort -> Grafana

Dashboard-sidecar problem:
Sidecar -> Grafana API authentication
A sidecar failure does not necessarily mean the public tunnel is broken.
Helm release locking issue
While updating monitoring releases, Helm returned:
another operation (install/upgrade/rollback) is in progress
The Grafana release also appeared as pending-install even though the pod was already running. A similar issue later affected the kps Prometheus release.
This occurs when Helm release metadata remains in a pending state after an interrupted or incomplete operation.
Useful diagnostics include:
helm list -n monitoring
helm status grafana -n monitoring
helm history grafana -n monitoring
helm status kps -n monitoring
helm history kps -n monitoring
Before attempting another upgrade, resolve the pending state through rollback, release metadata repair, or a controlled reinstall.
Verification commands
The following commands provide a complete basic health check.
# Nodes and workloads
kubectl get nodes -o wide
kubectl get pods -A

# Monitoring components
kubectl get pods -n monitoring
kubectl get svc -n monitoring
kubectl get pvc -n monitoring

# Grafana exposure
kubectl get svc grafana -n monitoring -o wide
kubectl get ingress -n monitoring

# Services on the hosts
sudo systemctl status k3s
sudo systemctl status cloudflared

# Cloudflare configuration
sudo cat /etc/cloudflared/config.yml
Current architecture limitations
Although the environment uses three K3s control-plane and etcd nodes, several components still contain single points of failure.
Kubernetes API endpoint
The bastion currently uses https://10.0.2.6:6443. If k3s01 becomes unavailable, the etcd cluster may remain operational, but the bastion kubeconfig will still point to the unavailable node.
A fully highly available API endpoint would require one of:
- kube-vip
- HAProxy
- Keepalived
- A dedicated TCP load balancer
- Another stable virtual IP mechanism
Grafana public endpoint
Cloudflare currently forwards Grafana traffic to 10.0.2.6:30300. Although a NodePort is normally available on every Kubernetes node, the Cloudflare configuration still targets one specific node IP.
If k3s01 fails, public Grafana access may stop until the origin changes to another node.
Future options include:
- A load-balanced origin
- A virtual IP
- Multiple Cloudflare Tunnel connectors
- Kubernetes Ingress through a stable endpoint
Cloudflare connector
The bastion runs the only cloudflared connector. If it stops, both the remote SSH path and public Grafana path become unavailable. A second connector could provide redundancy.
Persistent storage
The cluster relies on K3s local-path storage. Local-path volumes are tied to individual nodes and do not provide distributed storage.
Potential future options include:
- Longhorn
- Rook Ceph
- NFS
- External iSCSI storage
Etcd backup location
Etcd snapshots should be copied outside the Kubernetes nodes. Backups stored only on cluster nodes do not protect against complete host failure or disk corruption.
Security rules followed
The environment follows several important security principles:
- Kubernetes API: The API is private and is not exposed directly to the public internet.
- SSH: K3s nodes are not individually exposed through the home router. Administrative traffic enters through the bastion.
- Cloudflare Tunnel: The tunnel is outbound-only from the bastion. No inbound router port forwarding is required.
- Prometheus: Prometheus remains private inside the Kubernetes cluster.
- Grafana: Only Grafana is publicly reachable, through Cloudflare HTTPS and Cloudflare Access.
- Node communication: All K3s nodes remain on the same VM-to-VM-capable VirtualBox network.
What I learned
High availability involves more than three control-plane nodes
A three-member etcd cluster provides control-plane data redundancy, but the environment is not fully highly available until the API endpoint, storage layer, tunnel connector, and public-service origin are also redundant.
VirtualBox network mode matters
Standard NAT and NAT Network behave differently. Choosing the wrong adapter type can prevent cluster nodes from communicating even when their IP addresses appear correct.
A running pod does not guarantee a healthy Helm release
Kubernetes workloads can continue running while Helm metadata remains stuck in pending-install or another pending state.
Public exposure and application authentication are separate layers
Cloudflare, the Kubernetes NodePort, Grafana authentication, and the dashboard sidecar are separate components. A failure in one layer does not automatically identify the cause of a failure in another.
NodePort and Ingress are different exposure models
Grafana currently uses NodePort. Traefik is present in the cluster, but it is not part of the Grafana exposure path.
A bastion simplifies access control
Using one controlled administrative entry point is easier to manage than exposing SSH individually on every cluster node.
Current status
The homelab currently includes:
- Windows 11 host operating system
- Oracle VirtualBox
- Four RHEL 10.2 virtual machines
- Dedicated bastion server
- Three-node K3s server cluster
- Three-member embedded etcd quorum
- All K3s servers enabled as workers
- Private Kubernetes API access
- Bastion-based kubectl access
- Helm package management
- Prometheus monitoring
- Separately managed Grafana deployment
- Grafana NodePort on TCP
30300 - Public Grafana access through Cloudflare Tunnel
- Remote bastion access through Cloudflare
- No direct public exposure of Kubernetes nodes
Planned improvements
The next improvements should remove the remaining single points of failure:
- Add a stable Kubernetes API virtual IP.
- Configure automated etcd snapshots.
- Copy etcd backups outside the cluster.
- Add distributed or external persistent storage.
- Add a secondary Cloudflare Tunnel connector.
- Remove Helm releases from pending states.
- Verify persistent
firewalldrules. - Verify the final SELinux mode.
- Test node-failure and recovery scenarios.
- Deploy additional applications behind a controlled exposure mechanism.
Conclusion
This homelab started as a small VirtualBox-based Kubernetes environment and evolved into a three-node K3s cluster with embedded etcd, centralized administration, Prometheus monitoring, Grafana dashboards, and secure remote access through Cloudflare Tunnel.
The design is sufficient for learning Kubernetes operations, Helm, observability, networking, service exposure, and high-availability concepts.
It also demonstrates an important infrastructure principle: deploying multiple control-plane nodes is only one part of high availability. The API endpoint, storage, monitoring access path, tunnel connector, and backups must also be designed for failure.
The environment is now ready for application deployments, automated backups, distributed storage, failure testing, GitOps, and more advanced Kubernetes networking.